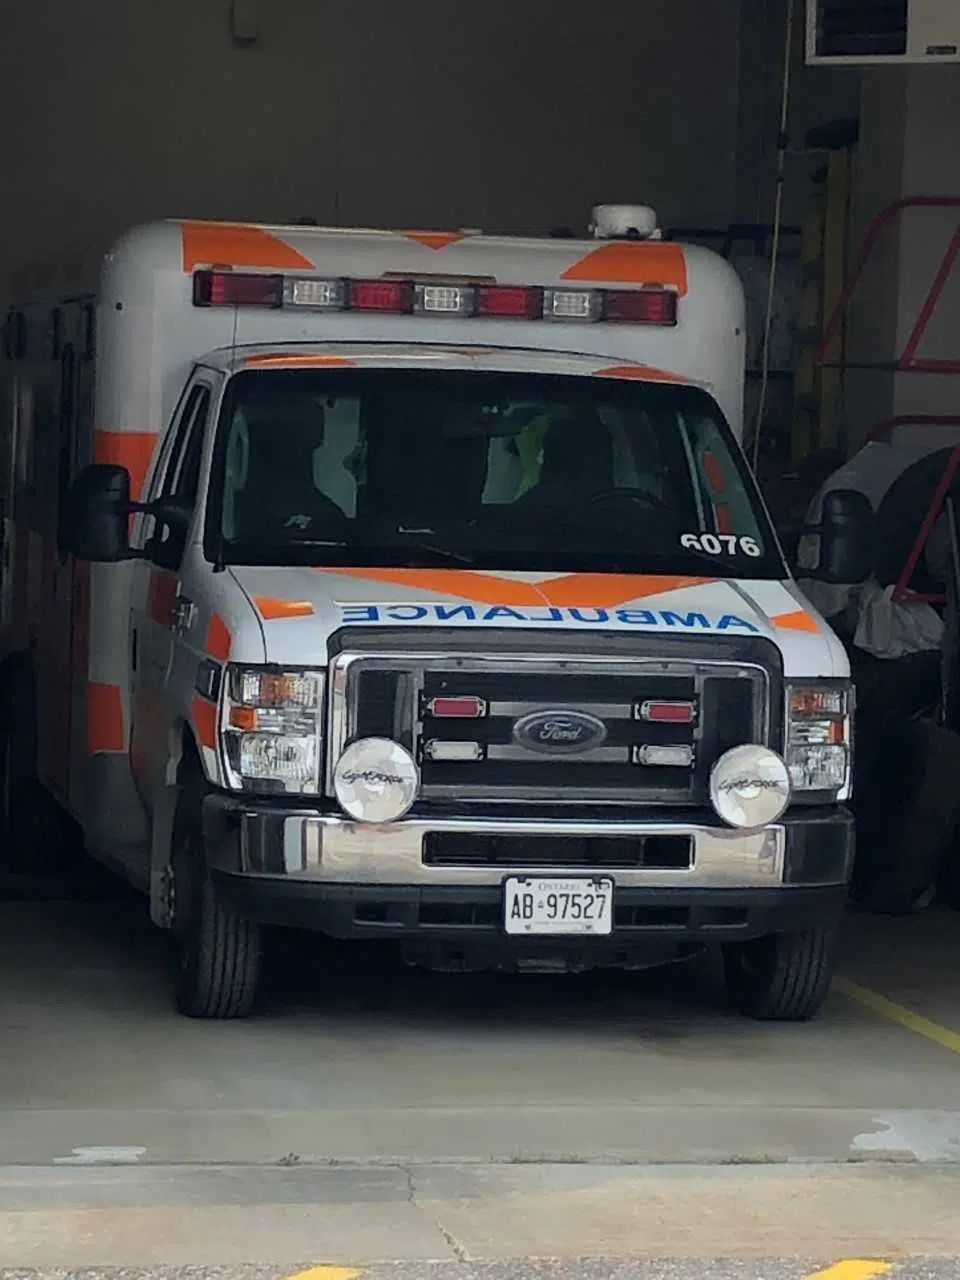
The Kenora District Services Board is taking a close look at call volumes for land ambulance service.
Chief Administrative Officer Henry Wall says calls for service in 2020 totalled 15,833 up about 1% compared to the year before.
Wall notes some communities saw dramatic spikes.
“Pickle Lake where our call volume went up almost 22% over the last year. Ear Falls was 17%. In Kenora it went up by just over 5%. So those are certainly things that we are looking at to see what were the causes of that.”
Wall notes people holding off on seeking immediate medical care due to COVID-19 concerns may have played a factor.
The high numbers are in spite of a decline of ambulance calls in the second quarter of 2020 due to pandemic restrictions.
He adds much of the change in call volume is not related to patient transfers.
In fact there was a decrease of 30% of Winnipeg transfers directly related to COVID restrictions.
Wall says one community bucked the trend.
“We saw a nearly 13% reduction in our call volumes for the community of Sioux Lookout. So that’s about a 600 call reduction less in Code 4 calls. There not a result in a reduction in doing medical airport transfers or between facility to hospital transfers.”
Wall says there may be one reason behind the decline.
“The additional housing that’s been built in Sioux Lookout. The supportive housing that has been created in the community. Helping those who are part of a vulnerable population with housing but also with a housing first approach.”
Wall notes, “We’re going to look into it much more closer but on the surface it’s looking like those strategies, those plans, really start to pay off in terms of seeing a call volume reduction in the community and perhaps something that we can learn from and do in other communities as well, especially in Kenora and Pickle Lake.”
He says that review will take place over the next couple of months.
Here is a breakdown on call distribution by EMS stations:
Dryden
2020: 2,346
2019: 2,242
2018: 2,138
2017: 1,987
2016: 1,872
Ear Falls
2020: 277
2019: 238
2018: 196
2017: 231
2016: 207
Ignace
2020: 307
2019: 280
2018: 310
2017: 270
2016: 309
Kenora
2020: 6,498
2019: 6,177
2018: 5,391
2017: 5,104
2016: 4,705
Nestor Falls
2020: 186
2019: 175
2018: 170
2017: 186
2016: 124
Pickle Lake
2020: 612
2019: 506
2018: 535
2017: 463
2016: 451
Red Lake
2020: 1,095
2019: 975
2018: 950
2017: 955
2016: 901
Sioux Lookout
2020: 4,201
2019: 4,833
2018: 4,406
2017: 4,189
2016: 3,591
Sioux Narrows
2020: 319
2019: 282
2018: 269
2017: 313
2016: 252


